
As the dead-tree media line up with badgery stories, we thought we'd do something slightly different. We will track the disgraceful decline of this country's so-called TB eradication programme using Defra's own maps.

After the Attested herds scheme of the 1950s and 60s, we were so nearly TB free. But a couple of 'hotspots' remained, which finally responded to parallel action on badgers after the mid 1970s.
Farmers controlled badger numbers.
The Protection of Badgers Act (1972) meant that any population control, for any reason, was by license only. MAFF controlled badgers " to prevent the spread of disease".
And in 1986, where at least one confirmed TB reactor had triggered annual tests for the parish, the maps looked like this.
638 cattle were slaughtered in 1986.

After 1986, the real decline began, as gassing of a complete group of badgers implicated in cattle breakdowns by MAFF, was replaced with cage traps and shooting those that hadn't been released or moved.
But the big change was the land allocated to the Ministry wildlife teams. This was reduced during the Interim Strategy operating 1988 - 97 from 7km down to just 1km and then only on land cattle had grazed.
All arable, woodland or neighbouring land was out of bounds to the wildlife teams - if not badgers..
Over the same period badger numbers were estimated to have increased by 77 per cent.
The 1996 map tells its own story of expanding hotspots.
3,881 cattle were slaughtered in 1996.
In 1997, the then Labour government accepted a £1m bung from the Political Animal Lobby (PAL), and a moratorium was introduced overnight on Section 10 (2) of the Protection of Badgers Act.
No licenses were issued to "prevent the spread of disease".
Two years later, the number of cattle slaughtered had doubled.
The moratorium is still in place.
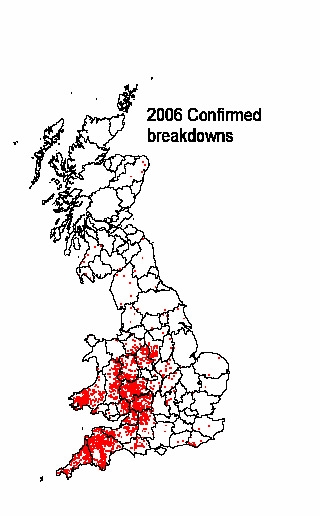
The 2006 map shows hotspots expanding like Topsy.
MAFF was now been re invented as DEFRA.
22,282 cattle were slaughtered in 2006.

After the end of the
Pre movement testing was introduced in a valiant attempt to find this hidden reservoir of Tuberculosis in cattle.
The 2011 map showed the annual testing area as solid red, increased by several miles from Defra's original 2010 model. As far as badger could walk?
34,617 cattle were slaughtered in 2011.

Fast forward to this weeks' announcement of several new annual testing areas.
Please excuse the home made map - but as you can see, many buffer counties and those with sporadic and expanding problems now require annual tests and preMT of their cattle.
Defra say : "The number of cattle compulsorily slaughtered as reactors or direct contacts was 21,512 in January to July 2012, compared to 20,514 in January to July 2011."
Thus in 2012, reactors slaughtered so far, have increased by 1000 head over the Jan - July 2011 figure.
.
 |
We think the new format of Defra's maps looks a tad truncated. In fact, very odd. We prefer the old format.
Wales has devolved completely - as have its figures in most of the press reports. And Scotland's head is removed.
Nevertheless the GB map, minus its top and left side, we print here - straight from Defra's new 2013 pdf file,
which explains their new cattle measures.
This whole sorry 35 year picture gallery could be entitled 'A Ministerial Victory for Tuberculosis'.
.
No comments:
Post a Comment